
DustComm Pro Software
DustComm Pro software is Windows-based software which is supplied free with SKC Particulate Monitors (HAZ-DUST IV, Split2, EPAM 5000, AIR-AIDE and the optional data logger for HAZ-DUST I). DustComm Pro is both a communications application that enables stored data within the Particulate Monitor to be downloaded to a PC, and a data manipulation tool enabling detailed analysis and reporting of sampled data.
The data plots provided with DustComm Pro enable:
- Detailed statistical analysis
- Creation of graphs and charts
- Mathematical correction of particle characteristics when the aerosol significantly differs from calibration dust
- The data to be exported to Microsoft Excel for further analysis and reporting
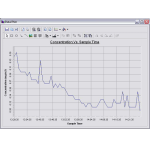
Sample screenshots are shown below:
After the data is downloaded from the monitor the following screen is displayed, showing the data for the first location and the data pertinent to the first sample at that location.

The following detail the various panels on this screen.
This provides the general downloaded statistics for this location.

This shows the specific information about the downloaded data, such as the data type and the readings recorded.

This enables the scale factor to be adjusted to be equal to your specific type of dust.

This shows the sample reading and time at which the reading was collected. As the readings are scrolled through the information in the DataSet and Location Information Panels will be updated.

This displays a miniature version of the Full Plot, to provide a quick overview. The Full Plot is accessed by clicking on the Button shown.

The graph is fully customisable - the graph can be line or bar, gridlines can be added/removed, the data points can be highlighted with a choice of graphics, colours changed, the graph can be zoomed into between any two points, notes (and pictures) added, the title changed and so on. The graph can also be printed, or exported for use in reports.
